|
|
|
Who's Online
There currently are 6012 guests online. |
|
Categories
|
|
Information
|
|
Featured Product
|
|
|
 |
|
|
There are currently no product reviews.
 ;
I am very happy with the owner's manual. I bought a used Casio and was so relieved that I was able to get a hold of a owner's manual. It was very easy to download the manual and I had no problems with printing it. Thank you! Nancy Whalen
;
The purchased manual is an high-quality scan of the original JVC paper-based Owner´s Manual. I am very satisfied!
;
Very satisfied with received document, all is right, Thank You very much, it was a Pleasure to work with You.
 ;
great site, the most easy and fastest way to find the manual you need, no 5 star because the manual was only available in german, but I speak german as well so no problem for me.
;
thanks for this download i got a pioneer bdp-lx70a blu-ray player and it had no manual i search everywhere on the internet and came across owner-manuals.com and i found that it was so easy to find and downloaded from this site if i ever need a manual again this would be the first place that i would come too thanks guys
Each of the following tracks produces a low-frequency test tone. The range of these tests is from 100Hz down to 20Hz.The frequency of each test is announced before it begins.The first test is the highest frequency (100Hz); therefore, you will be marking the template from right to left. Each frequency point is listed across the bottom of the Measurement Template (this is
w
When finished, press Skip to advance to the next test. Repeat the process described above for Tracks 5 through 26. When you have completed the 23 measurements, you are ready to analyze the data and make corrective adjustments.The completed Measurement template will look something like the example in Figure 18. Completed R.A.B.O.S. template
w
called the X-axis). See Figure 15 on the previous page.The vertical scale on the left side of the template indicates relative level, in dBs (the Y-axis).The template�s vertical scale matches that of the RSLM bar graph. Cue Track 4 and Pause II. From now on, you will want to keep your CD player�s remote control handy. Press Play . As Track 4 plays, observe the level indicated on the RSLM. EXAMPLE:The test frequency is 100Hz and the level indicated is -2dB. Find the intersection of 100Hz (X-axis) and -2dB (Y-axis). Place a dot at that point. See Figure 16.
Locating a test point
FIGURE 18
Now connect the dots as shown in Figure 19. This will make interpretation of the data much easier.
FIGURE 16
It takes a few seconds for the RSLM reading to stabilize, especially at very low frequencies. Don�t rush. Give each test adequate time for the meter to stabilize. At the bottom of the bar graph is a green �ON� LED.This LED is illuminated whenever the sound level is below the measuring range of the RSLM. If this occurs during a test, place a dot at the intersection of the test frequency and the bottom frame of the template. See Figure 17.
Test example with dots connected
w
Indicating an under-range test
FIGURE 19
FIGURE 17
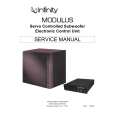
MODULUS
13
|
|
|
> |
|